The typical Biloxi home was worth $241,021 in September, a record and up 3.2% in a year. North Biloxi's ZIP code rose 4%; Ocean Springs slipped a fourth month.
Biloxi home values rose for an 11th straight month in September. The typical home in the city was worth $241,021, up $633 from August. That is the highest figure since Zillow’s Biloxi series began in 2010.
Values are up $7,557, or 3.2%, from September 2025.
The figures come from the Zillow Home Value Index, which Zillow Research published Oct. 16. The index covers single-family homes and condos together and tracks the middle third of homes by value. It is a smoothed, seasonally adjusted estimate, not a sale price.
The climb is faster than it was. A year ago the typical Biloxi home had risen just 0.9% in 12 months, and values slipped from July to October 2025. The run of gains began in November 2025. The biggest single month was February, at $1,580.
What it means for you
- Owners: the typical home gained about $7,600 in a year, more than three times the gain of the year before.
- Buyers: Biloxi now sits about $11,000 above the Harrison County typical value of $229,862, and about $35,000 above Gulfport.
- Sellers: homes are taking longer to sell. The median listing in the Gulfport metro area went under contract in 44 days in September, against 38 days a year earlier, Zillow’s days to pending figures show.
- Renters: the typical asking rent rose 4% in a year, a little faster than home values.
- Property taxes: your assessed value comes from the Harrison County Tax Assessor, not Zillow. See our property tax guide.
Month by month
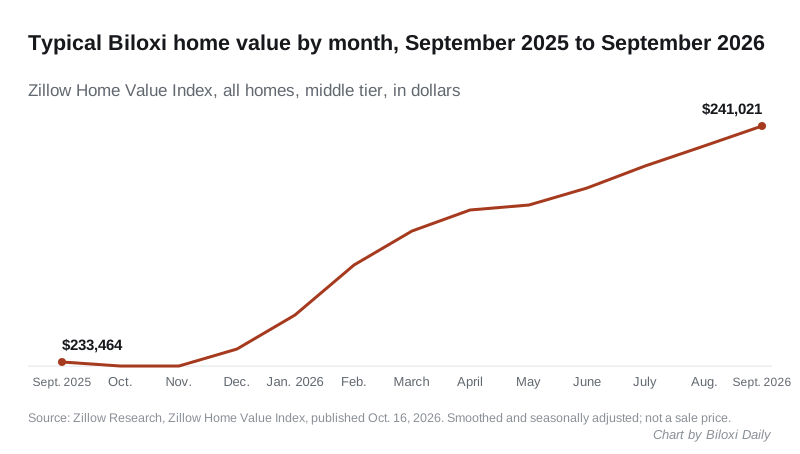
| Month | Typical value | Change on the month |
|---|---|---|
| September 2025 | $233,464 | |
| October 2025 | $233,334 | -$130 |
| November 2025 | $233,350 | +$16 |
| December 2025 | $233,868 | +$519 |
| January 2026 | $234,978 | +$1,110 |
| February 2026 | $236,558 | +$1,580 |
| March 2026 | $237,662 | +$1,104 |
| June 2026 | $239,050 | +$564 |
| July 2026 | $239,753 | +$704 |
| August 2026 | $240,388 | +$634 |
| September 2026 | $241,021 | +$633 |
Zillow revises past months with each release. Its August estimate for Biloxi is now $240,388, up from the $238,012 it published a month ago and we carried on our home prices page.
By ZIP code
North Biloxi led. East Biloxi, home to downtown and Point Cadet, barely moved.
| ZIP code | Area | Typical value, September 2026 | One-year change |
|---|---|---|---|
| 39532 | North Biloxi, Cedar Lake and Woolmarket | $279,272 | +4% |
| 39531 | West Biloxi and Edgewater | $205,581 | +2.4% |
| 39530 | East Biloxi and downtown | $159,759 | +0.8% |
Source: Zillow’s ZIP code index file. ZIP codes do not follow the city line exactly.
In 39532, the typical value rose $10,624 in a year, from $268,648. Our guides to North Biloxi, West Biloxi and East Biloxi cover each area.
How the neighbors compare
Biloxi rose faster than Harrison County and every neighbor Zillow tracks. Ocean Springs, about nine miles east across the Biloxi Bay Bridge, is still the priciest. But its typical value has fallen four months in a row, from $274,137 in May.
| Place | Typical value, September 2026 | One-year change |
|---|---|---|
| Ocean Springs | $273,211 | +0.5% |
| Biloxi | $241,021 | +3.2% |
| Long Beach | $239,781 | +1.2% |
| Harrison County | $229,862 | +2.8% |
| Gulfport | $206,122 | +2.2% |
Sources: Zillow’s city and county index files. Gulfport is about eight miles west and Long Beach about 14 miles west. Zillow does not publish a city figure for D’Iberville, about three miles north.
Biloxi ranks 32nd of the 319 Mississippi cities in Zillow’s index.
Rents
The typical asking rent in Biloxi was $1,341 in September, according to the Zillow Observed Rent Index. That is up $52, or 4%, from $1,289 a year earlier, and up 0.8% from $1,331 in August.
More on the local market, including sale prices, is on our Biloxi home prices page. Recorded sales are listed in real estate transfers, and values area by area are in our neighborhoods guide.
Have your say